


This article is part of our Rounding Third series.
Every year I like to look back at the past three seasons to determine what it took to reach certain category targets in the NFBC 15-team Main Event, 12-team Online Championship and the 15-team TGFBI contests. I selected those contests because of the high sample size each provide, and the readily available data. It's important to understand that each of these contests has an overall contest component, and thus makes strategies where one punts a category very difficult, albeit not impossible. In a stand-alone league, those strategies are a lot more viable.
As always, I'm going to list the 80th/70th/50th percentile category targets for each stat. The general rule of thumb is that you need to average the 80th percentile across each category in order to win your league and contend for a paying spot in the overall main event. You need to average the 70th percentile to try to cash in your individual league. And the 50th percentile is listed as a basic guidepost to illustrate where you're really falling behind if you fall short of that benchmark. We'll do hitting categories this week, and pitching categories next week.
Let's start off by taking a look at the league-wide data for hitting categories, before we start looking at fantasy league-specific information. The 2023 season introduced a number of significant changes to the game – you may have heard about them once or twice when watching a game! The rule changes increased stolen bases in the game considerably, with teams averaging
Every year I like to look back at the past three seasons to determine what it took to reach certain category targets in the NFBC 15-team Main Event, 12-team Online Championship and the 15-team TGFBI contests. I selected those contests because of the high sample size each provide, and the readily available data. It's important to understand that each of these contests has an overall contest component, and thus makes strategies where one punts a category very difficult, albeit not impossible. In a stand-alone league, those strategies are a lot more viable.
As always, I'm going to list the 80th/70th/50th percentile category targets for each stat. The general rule of thumb is that you need to average the 80th percentile across each category in order to win your league and contend for a paying spot in the overall main event. You need to average the 70th percentile to try to cash in your individual league. And the 50th percentile is listed as a basic guidepost to illustrate where you're really falling behind if you fall short of that benchmark. We'll do hitting categories this week, and pitching categories next week.
Let's start off by taking a look at the league-wide data for hitting categories, before we start looking at fantasy league-specific information. The 2023 season introduced a number of significant changes to the game – you may have heard about them once or twice when watching a game! The rule changes increased stolen bases in the game considerably, with teams averaging 0.72 stolen bases per game after averaging only 0.51 per game the year before. The league-wide batting average also increased from .243 to .248, and at least some of that jump has to be attributed to the shifting limitations in the game. You can see the full set of league-wide averages in the table below.
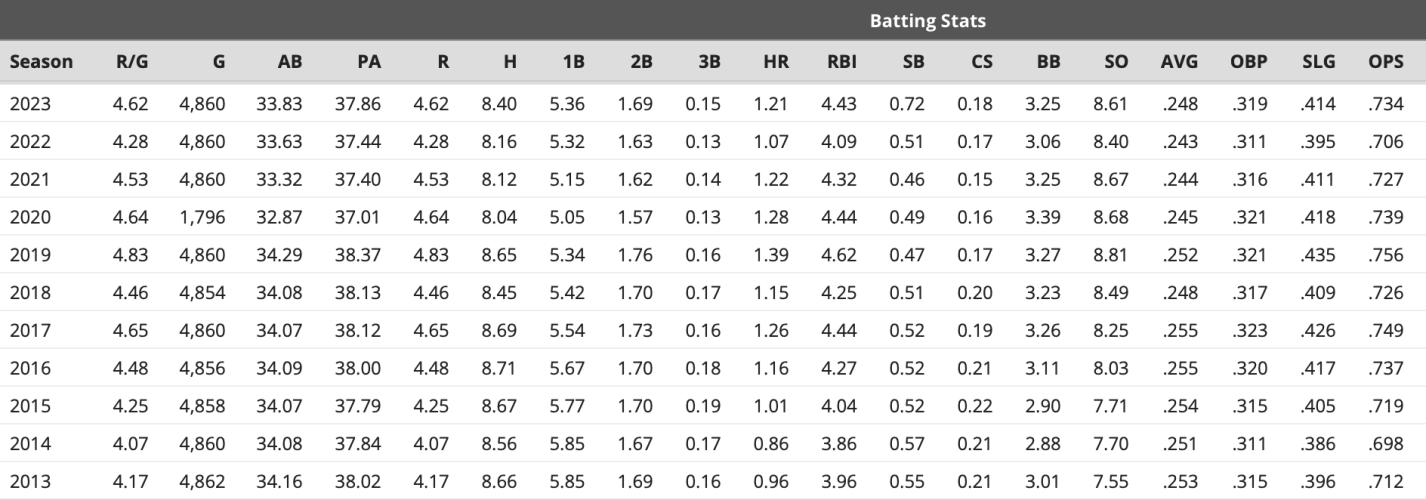
You can also observe that the run-scoring environment improved last year, though not all of that can be attributed to the increase in batting average and base-stealing. Home runs were back up - not quite to "happy fun ball" levels, but nearly identical to 2021 and close to when the ball became more lively in 2017.
Batting Average
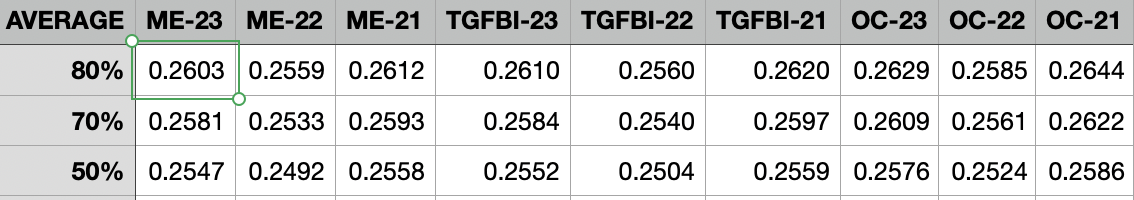
The limitations on defensive shifts were designed to boost batting averages, and they did, though maybe not as you might think. In all three game formats, the averages for each percentile target went up considerably over 2022 numbers but yet still below 2021 levels. Interestingly enough, we saw a greater percentage jump in homers than with any other type of hit, which might suggest that the batting average bump is less attributable to the shift rule changes than other factors. Unless strikeout levels can be dropped considerably, there's only so much we can do to increase batting averages.
Runs
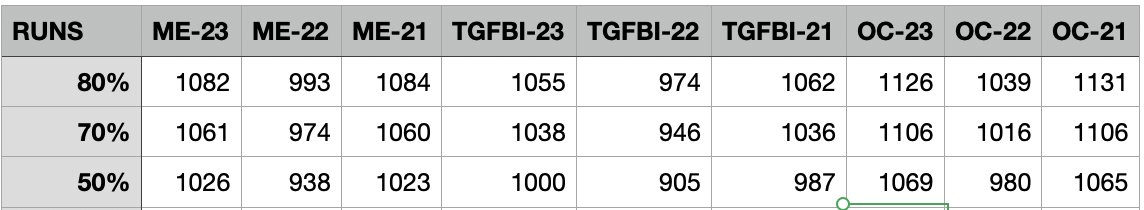
As with the rise in batting average, runs scored bounced back up to 2021 levels. I guess this illustrates just how much hitting production dropped off in 2022. To reach the 80th percentile in runs scored, each of your hitting roster slots needed to average more than 77 runs, compared to just under 71 runs per slot in 2022.
Home Runs
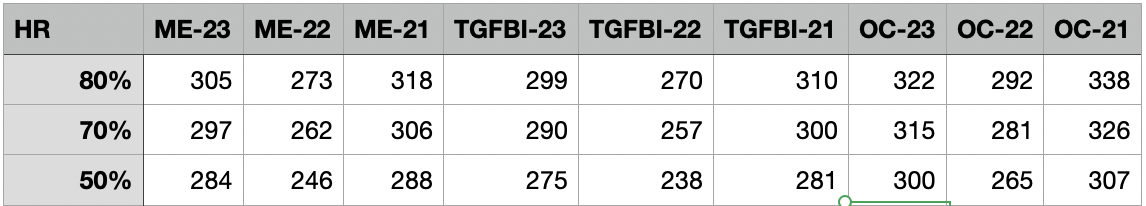
While the increase in homers still led to an 80th percentile that didn't match 2021 levels, let alone the Happy Fun Ball levels of 2019, it's still a dramatic increase. It's hard to overstate how important it is to get your power. The 1.21 homers per team per game from 2023 are still the fifth-highest rate in Major League Baseball history. To reach the 80th percentile in homers, a team needed 21.78 homers per roster spot last year. This is why I'm so reticent to roster Esteury Ruiz and lesser players of his ilk – speed guys who put you at a significant deficit in power, while not even helping you in the other three categories.
RBI
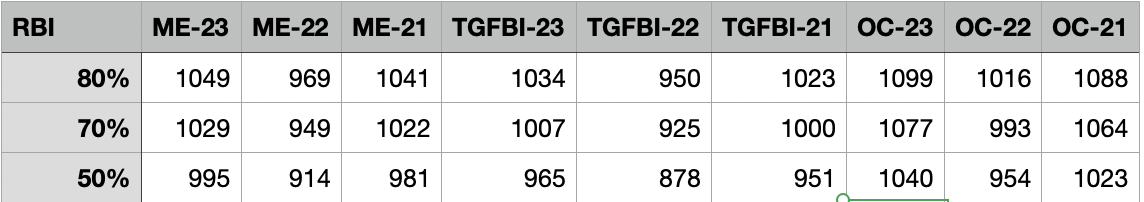
As always, the fluctuation in RBI targets mirrors that of our Runs targets, though the levels actually slightly surpassed 2021 levels. To hit the 80th percentile in RBI, a team needed to average 75 RBI per roster slot. Digging back a little farther, in 2019 a team needed a whopping 84 RBI per roster slot to hit that elusive 80th percentile.
Stolen Bases
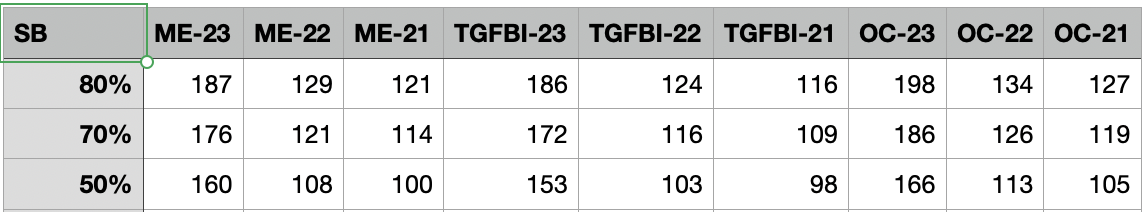
I should have led off with stolen bases! This is analogous to the leap in homers from 2018 to 2019, or maybe even more appropriately between 2015 to 2017, when the batted ball environment first started to change. The 3,503 total stolen bases in Major League Baseball were the second most in the modern era, behind only the 1987 season, which saw 3,585 total stolen bases. I drastically underestimated how many more stolen bases we'd need – I guessed somewhere around 142 to reach the 80th percentile. That wouldn't even had gotten us to the halfway mark.
With stolen bases more plentiful, we need to be more cognizant of getting speed from more spots on our rosters. We know that they cannot be distributed evenly, but on average an 80th percentile team needed 13.36 stolen bases per roster slot last year. But because stolen bases are mostly a single-category event (there's a small correlation to more runs scored), you have to make sure you don't dedicate too many resources to acquiring steals. Those who did overachieve in stolen bases in the 2023 NFBC Main Event were not rewarded with a high overall finish:
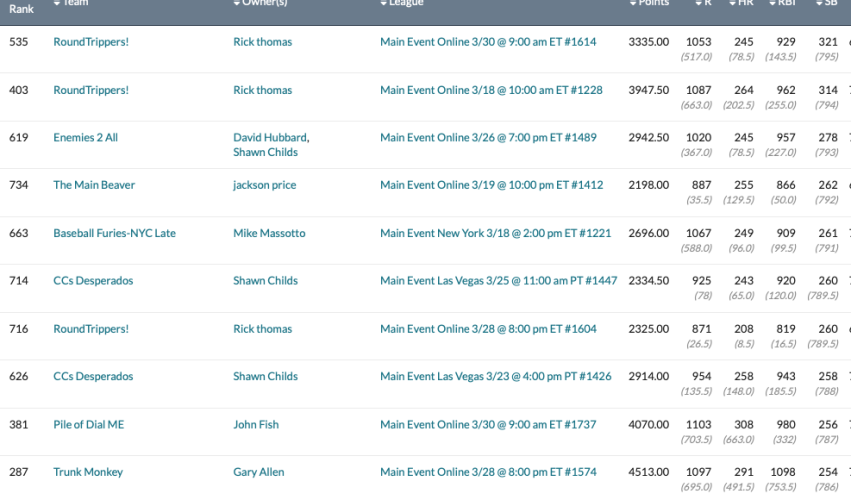
To be fair, those who extremely underachieved in stolen bases also fared poorly. You might, cough, recognize one of those teams:
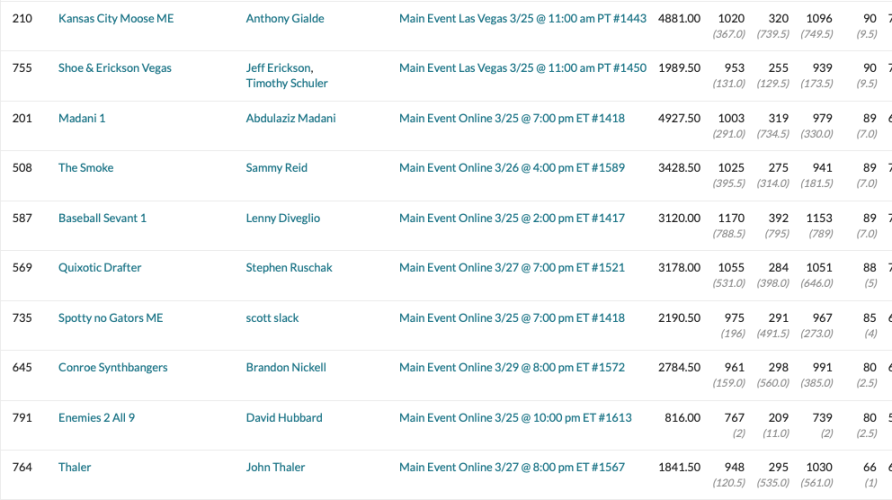
Mistakes were made.
My takeaway is probably the same as most analysts – get your foundation of stolen bases early, with the five-category hitters as best you can, so that you're not forced to roster Ruiz or lesser versions of him. If you do that, you can take more power hitters who don't run later in the draft – they're more plentiful and help in at least three categories (HR, RBI, R) as opposed to one. That's easier said than done, and doing so forces you to make sacrifices elsewhere. Perhaps that means you won't draft Pete Alonso or Matt Olson, or perhaps that means you take a later closer than one of the top-five closers in the fourth round – that will likely be my approach. If I land in the 50 to 70th percentile in stolen bases that way, so be it. Bryan Fitzgerald at PullHitter wrote an article that illustrated, among other things, that dominance in stolen bases and saves were less correlated with overall success in the Main Event than dominance in other categories.
The data above is necessarily backward looking, and we don't know all the changes that will potentially shape our stats in 2024. Hopefully the league doesn't drastically change the ball again, or have some other undeclared omnibus change that radically alters output. This might be the first "normal" year in a long time – no lockout, no sweeping rules changes, no pandemic, no Happy Fun Ball. As a result, this might produce the most stable data we've seen in a long time. Or ... well, life comes at us fast and the next big change will blindside us.